Amira Remadna. Energy Data Analyst | GECF | Data and Information Services Department
The following is a general overview of the main gas value chain figures of GECF Countries within 2016 worldwide context, reflected through GECF ASB 2017 data and JODI Gas World Database.
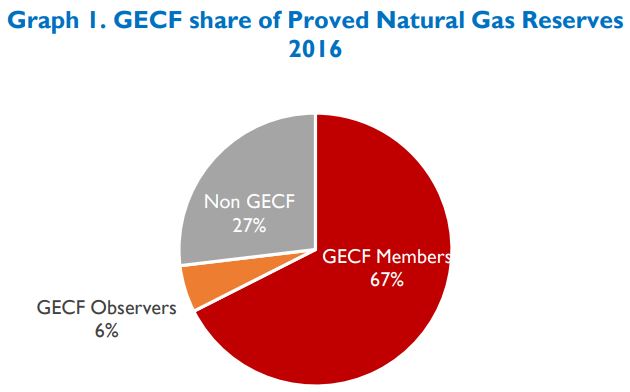
GECF Countries represent the largest producer and exporter of natural gas in the world, according to the GECF ASB 2017 edition, having as well the largest worldwide volume of proved natural gas reserves. In numbers, GECF Proved Natural Gas Reserves at the end of the year 2016, set at 141.4 Trillion cubic metres depicting thus a share of 73% in the total world proved natural gas reserves (Graph.1).
In 2016, the total volume of natural gas produced by GECF Countries reached 2065.3 Billion cubic metres (Bcm), representing 58% of the world natural gas produced in this period. Within the same year, the total volume of GECF natural gas exported through pipelines reached 479.4 Bcm, while LNG exports recorded 206.2 Bcm, drawing each a worldwide share of 65% and 61% respectively (Graph.2).
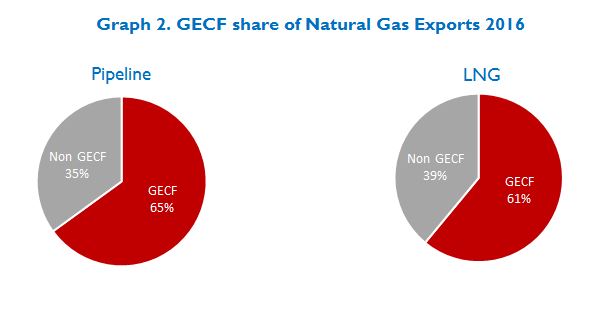
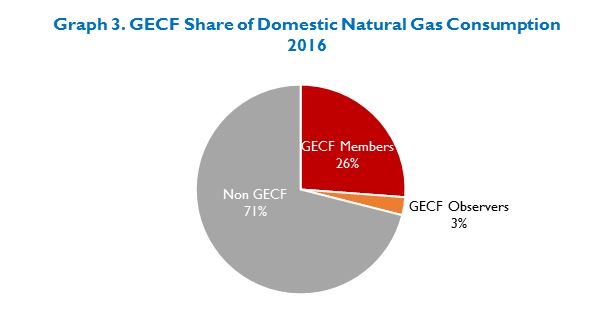
In comparison with 2015 data, the share of GECF Gross Natural Gas Production in the world progressed by 0.5 point in 2016 and by 2.6 points in terms of global gas trade by pipeline. As per LNG exports, the total world progressed by 2.3%, on Year-Over-Year (Y-O-Y) evolution, whereas the GECF share stepped back by 3.6 points equivalent to 7.2 Bcm from 2015 to 2016. From a domestic angle of view, GECF countries consumed in 2016, 1018.3 Bcm of natural gas, exceeding one quarter of the total worldwide natural gas consumed in 2016 (Graph.3). Within the period 2015-2016, GECF Domestic Natural Gas Consumption increased by 27.4 Bcm, translating thus a Y-O-Y growth of +2.8%.
As per Non GECF natural gas exports, according to the JODI Gas World Database, the world Top 5 Non GECF countries exported in 2016 a cumulative volume of 325.7 Bcm, dominated mainly by Canada (25.2%), Germany (21.7%), United States (20.3%), Australia (18%), and Slovak Republic (14.8%). In terms of imports, the world Top 5 countries absorbed in 2016 around 497 Bcm of natural gas, which was shared by Germany (30.3%), Japan (24.2%), United States (17.1%), China (15.3%), and Italy (13.1%) . In percentage that is a growth of almost +16% compared to 2015.