As global demand for energy continues to rise, LNG trade has seen substantial growth in recent years. This trend has been accompanied by a parallel expansion of the LNG carrier fleet, which has grown from 60 vessels in 2000 to 780 carriers in 2024. This nearly thirteen-fold increase highlights the rising significance of LNG shipping, which has outpaced all other segments of the global gas supply chain in terms of growth.
The LNG shipping market is divided into two segments: long-term and spot chartering. Long-term chartering involves carriers that serve long-term LNG supply contracts and are assigned to fixed, predictable routes between designated liquefaction and regasification terminals. In contrast, spot chartering serves the spot LNG trading market, which represents about 30% of global LNG trade. These two segments generally operate independently, with little overlap.
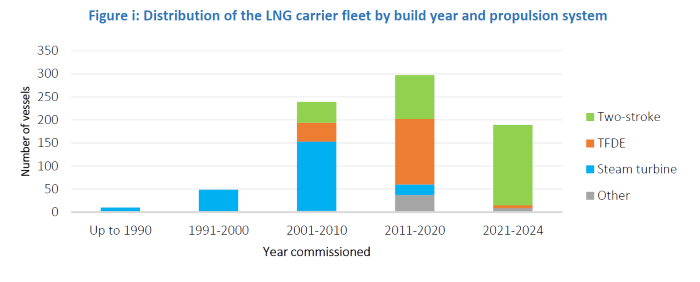
Additionally, the LNG carrier fleet is categorized into three main elements based on propulsion technology: steam turbine, TFDE (tri-fuel diesel electric), and two-stroke engines (Figure i). While all types of carriers use LNG boil-off for propulsion, they also rely on other fuels: steam turbine vessels use HFO (heavy fuel oil), TFDE vessels consume marine diesel oil and HFO/ LSFO (low-sulphur fuel oil), and two-stroke vessels use marine gasoil, LSFO, and LNG bunker fuel.
Steam turbine LNG carriers, the first generation of the fleet, account for 30% of the total fleet. While these vessels are being gradually replaced by newer, larger, and more fuel-efficient carriers, they continue to play a crucial role in spot LNG trade, especially during peak demand periods, such as the winter months in the northern hemisphere. As new-generation LNG carriers are primarily deployed for long-term chartering, a growing number of steam turbine vessels, once dedicated to long-term contracts, are being redirected to the spot market.
Source: GECF Secretariat based on data from ICIS
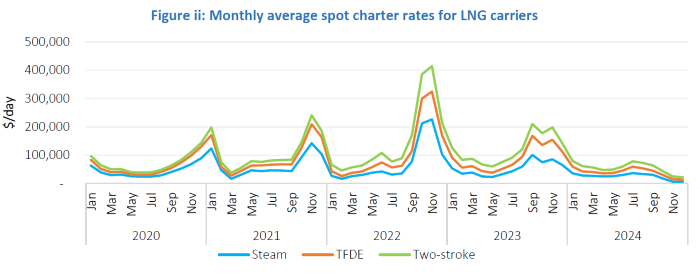
Spot charter rates for new two-stroke carriers are the highest, reflecting their substantial construction cost (exceeding $200 million per vessel), while the rates for old steam turbine carriers are the lowest. However, two-stroke carriers are increasingly preferred over other types of LNG carriers due to their superior fuel efficiency and larger cargo capacity, which result in reduced shipping unit costs driven by economies of scale. Furthermore, two-stroke carriers are better equipped to meet stringent maritime environmental regulations.
Spot charter rates are primarily influenced by the volume of spot LNG trade and the availability of LNG carriers in the spot market. These rates typically follow a seasonal trend, staying stable during periods of regular LNG demand but rising in the fourth quarter as Europe and Asia compete for cargoes ahead of the winter heating season. Notably, record highs were reached during the energy crisis of 2022.
In this context, the year 2024 proved to be exceptional for the LNG shipping market, as the average annual spot charter rate for steam turbine LNG carriers plummeted to a record low of $25,000/day, down from $43,000/day in 2020, $65,000/day in 2021, $72,000/day in 2022, and $53,000/day in 2023. This sharp decline was attributed to a sharp drop in spot charter rates in the fourth quarter, marking a notable deviation from the typical seasonal trend (Figure ii).
Source: GECF Secretariat based on data from Argus
The interplay of several factors has led to a greater availability of LNG carriers in the spot charter market, exerting downward pressure on spot charter rates.
First, the LNG shipping market has experienced a record-breaking expansion of the carrier fleet, with the number of newly commissioned vessels reaching 70, surpassing the previous record of 54 carriers reached in 2021. The rate of new vessel additions has significantly outpaced the growth of global LNG export capacity in 2024.
Second, many of these newly commissioned LNG carriers were initially ordered for long-term charter contracts linked to upcoming liquefaction projects. However, due to the common practice of commissioning vessels before the commercial operations of LNG liquefaction plants commence, coupled with delays in the startup of some projects, many of these carriers have been temporarily redirected to the spot charter market.
Third, the decline in LNG cargoes used for floating storage contributed to the slump in spot charter rates in Q4 2024. Floating storage typically occurs around European ports in the fourth quarter, driven by a spot price contango. This happens when expectations of higher gas demand during the winter months prompt traders to store LNG on carriers near regasification terminals, aiming to capitalize on higher spot prices as the winter season progresses. Up to 20 carriers were estimated to be used for floating storage in Europe in Q4 2023. However, in Q4 2024, with minimal spot price contango and a year-on-year decline in LNG imports, floating storage in Europe was nearly non-existent.
Meanwhile, these atypical trends are unlikely to indicate a structural shift in the LNG shipping market, which is set to face new challenges ahead.
In the medium term, between 2025 and 2029, global LNG liquefaction capacity is expected to grow by 45%, from 500 Mtpa to 720 Mtpa. This significant increase in liquefaction capacity will necessitate a corresponding expansion of LNG shipping capacity to transport the additional volumes of LNG to the global market. Consequently, a key question arises regarding whether the LNG shipping industry will be able to effectively manage the challenges associated with accommodating this surge in LNG supply.
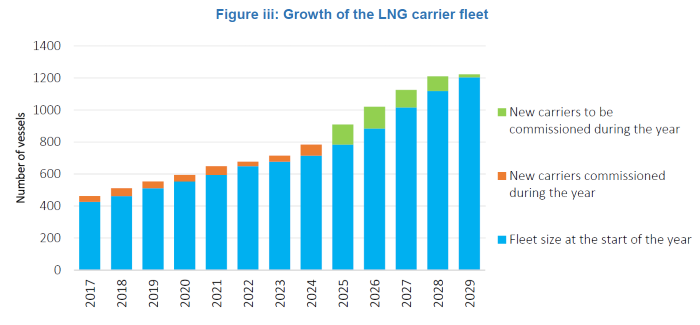
In this context, the year 2025 marks the beginning of a period during which approximately 500 new LNG carriers are expected to enter service by the end of the decade, representing an increase of over 50% in the total number of vessels compared to current levels (Figure iii). Notably, the next four years will set new annual records for the commissioning of LNG carriers.
The building of new LNG carriers is closely tied to the commissioning of new liquefaction plants, with market players placing vessel orders assigned to specific projects well in advance. LNG carrier construction is a highly specialized process, which requires a skilled and experienced workforce and typically takes between 18 to 24 months. South Korea, home to prominent shipyards such as Samsung Heavy Industries, Hyundai Heavy Industries and Hanwha Ocean, has historically been the global leader in LNG carrier construction. In the meantime, China has steadily gained ground in the market, offering additional shipyard capacity, improving quality and reducing costs. As a result, Chinese shipyards now account for a quarter of the LNG carrier orderbook through the end of the decade.
On the demand side, GECF member countries account for a substantial portion of the global LNG carrier orderbook. Notably, Qatar has placed orders for 128 new LNG carriers to support the North Field expansion and other projects. Russia and the UAE have also ordered new vessels to support the commissioning of LNG export projects in their respective countries. Additionally, other countries, such as Nigeria, have announced plans to modernize and expand their fleets.
Source: GECF Secretariat based on data from ICIS
New LNG carriers feature significantly higher capacity than their older-generation counterparts, enhancing their ability to accommodate the growing LNG supply. For instance, Qatar’s recent orders include over 20 carriers with capacity of 271,000 m³ of LNG, surpassing the previous record for carrying capacity. Currently, global LNG shipping capacity (780 LNG carriers) stands at 127 million m³, equivalent to 55 mt, serving 500 mtpa of liquefaction capacity. Between 2025 and 2029, LNG shipping capacity is expected to increase by 35 mt, while liquefaction capacity is projected to rise by 220 mtpa. As a result, the ratio of shipping capacity to liquefaction capacity will improve — each 1 mt of new shipping capacity will support 7 mtpa of liquefaction capacity in the new export projects, compared to 9 mtpa of liquefaction capacity today. This indicates that the LNG shipping industry is well positioned to handle the influx of new LNG supply.
Nevertheless, there are some factors, which may affect the medium-term development of the LNG shipping market, potentially limiting the growth of the global shipping capacity and leading to fluctuations in spot charter rates.
The number of operational LNG carriers will depend, to some extent, on the pace at which older steam turbine LNG carriers are retired, either through scrapping or conversion into Floating Storage Regasification Units (FSRUs) or Floating Liquefied Natural Gas (FLNG) units. Historically, the scrapping of older steam turbine vessels accounted for less than 1% of the fleet annually; however, this trend is expected to accelerate in the medium term due to the implementation of stricter maritime regulations aimed at enhancing operational efficiency and reducing greenhouse gas emissions. In the meantime, there are 48 FSRUs and 7 FLNGs currently in operation, and this number is anticipated to rise, particularly through conversion.
The availability of LNG shipping capacity is influenced by the voyage times of LNG carriers, which depend on the distances between LNG export and import terminals. Longer routes typically result in lower shipping capacity availability. With expected shifts in LNG trade routes — driven by the commissioning of numerous new liquefaction projects in the US (located far from key importing regions) and by increasing LNG import growth in East Asia — new LNG carriers are likely to undertake longer average voyage times. For instance, cargoes departing from the US Gulf Coast could take 50 days for a roundtrip to East Asia via the Panama Canal, compared to just 25 days for a roundtrip to Northern Europe or Brazil.
Voyage times may also be affected by developments related to transit through the Suez and Panama Canals. In 2024, traditional LNG shipping routes were partially disrupted. Geopolitical tensions in the Red Sea impacted LNG flows from the Middle East to Europe, resulting in rerouting around Africa via the Cape of Good Hope, which added up to 12 extra sailing days. Additionally, drought conditions in the Panama Canal reduced water levels and prompted transit restrictions, causing LNG cargoes from Trinidad and Tobago and the US Gulf Coast to East Asia to be rerouted around Africa, adding up to 14 extra sailing days.
Ultimately, these developments highlight the anticipated ability of the LNG shipping industry to accommodate the growing global LNG supply from new liquefaction projects, with GECF member countries playing a crucial role in shaping these trends.