The level of gas prices is a key factor impacting gas demand and the competitiveness of natural gas relative to other energy sources. When gas prices are lower than the parity prices of alternatives such as coal, oil, or renewables, natural gas becomes a more attractive option for consumers, driving higher demand. However, if gas prices rise significantly, consumers may shift to more cost-effective alternatives, thus reducing the market share of natural gas.
2024 marked a period of stabilization for spot gas prices, offering a sharp contrast to the extreme volatility witnessed over the previous four years, which saw both record lows and highs. TTF spot prices averaged $11/MMBtu in 2024, a decrease from $13/MMBtu in 2023, $38/MMBtu in 2022, and $16/MMBtu in 2021. This stabilization was largely driven by a balanced supply-demand environment, where rising gas consumption was met with adequate production growth, the effects of 2022 supply disruptions were mitigated, and higher gas storage levels provided enhanced supply security. However, despite the overall stability in market fundamentals, short-term price surges were still triggered by geopolitical tensions and extreme weather events. Moreover, gas spot prices remained elevated compared to pre-Covid levels.
Looking ahead, short-term spot gas price expectations are primarily driven by futures prices for key regional benchmarks. Futures contracts, which are standardized agreements to buy or sell commodities at a set price on a future date, are traded on regulated exchanges, offering market transparency and liquidity. In Europe, TTF serves as the main benchmark, while in Asia, NEA spot LNG prices and JKM futures are used. In North America, Henry Hub remains the primary benchmark for US gas prices. Futures prices offer strong insights into perceived market conditions and anticipated price movements. As market sentiment shifts, these prices can fluctuate significantly, even on a daily basis.
In 2025, global spot gas prices are expected to rise, driven by sustained growth in global gas demand, projected at 2%, and a positive economic outlook, with global GDP growth forecasted at over 3%. Contributing factors include a shift from coal to gas, increasing power generation needs, recovering industrial activity, and higher heating demand due to colder-than-usual winters across various regions. The primary sources of growth in global gas demand will be Asian countries, which remain heavily reliant on gas imports, particularly LNG. Meanwhile, the global LNG market is expected to remain relatively tight due to limited new LNG supply, despite the entry of new exporters and the addition of 54 Mtpa of new liquefaction capacity. However, much of this capacity will come online towards the end of the year, meaning its impact on trade flows will be limited throughout most of 2025.
In this context, TTF and JKM are expected to average around $13.5/MMBtu in 2025, with Henry Hub anticipated at $4.5/MMBtu, based on actual prices for January and February and futures prices for the remainder of the year (as of 14 March 2025) (Figure i). However, several factors could influence these projections. On the upside, potential delays in LNG facility startups, shifts in trade flows due to changes in US tariff policies and retaliatory actions from other countries, supply disruptions, and extreme weather events could push prices higher. On the downside, milder weather and weaker-than-expected economic growth could dampen gas demand, exerting downward pressure on prices.
In 2026, the market is expected to loosen as LNG liquefaction projects commissioned in 2025 ramp up production, and an additional 57 Mtpa of capacity comes online. Meanwhile, LNG demand is projected to grow at a moderate pace, primarily driven by Asia, while demand in Europe is anticipated to stabilize. As a result, supply growth may outpace the increase in demand, potentially leading to softer prices. Based on futures prices as of 14 March 2025, TTF and JKM are anticipated to average around $11/MMBtu in 2026, while Henry Hub is expected to remain at $4.5/MMBtu, supported by increased demand from new LNG plants.
Figure i: Actual and futures gas prices in 2024-2026
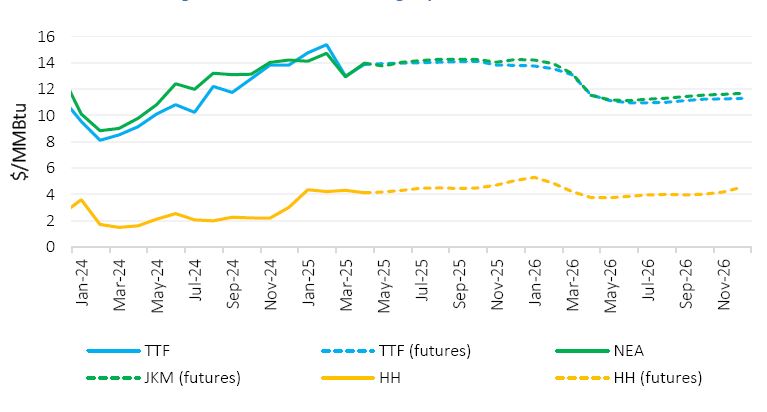
Source: GECF Secretariat based on data from Argus and LSEG
Note: Actual prices up to February 2025; futures prices as of March 14, 2025.
The seasonal price spread is a fundamental characteristic of gas markets, particularly in Europe, driven by seasonal fluctuations in gas demand and storage dynamics. Under normal market conditions, the TTF winter-summer spread is typically positive, encouraging storage injections during the summer and withdrawals in the winter, when heating demand drives prices higher.
However, the EU's gas storage regulation, introduced in response to the 2021-2022 energy crisis, has significantly impacted the economics of gas storage. This regulation requires member states to maintain gas inventories at 90% of storage capacity by November 1 each year. In this context, the winter-summer price spread turned negative in 2022, reaching an unprecedented level, and remained negative in 2023, albeit at a marginal level. In 2024, the spread reversed to positive, returning to historical norms, primarily due to low injection requirements during the summer, supported by high storage levels at the end of the 2023/2024 winter season (Figure ii).
However, the TTF winter-summer spread for 2025, based on futures prices, once again turns negative, reflecting an atypical seasonal trend, with average summer 2025 prices showing a slight premium over average winter 2025/2026 prices. This trend undermines the economic feasibility of summer storage injections for 2025. Looking ahead to 2026, the TTF winter-summer spread is expected to become positive. However, the movement of the spread will be contingent on future policy developments regarding EU gas storage requirements.
Figure ii: Trend in TTF spot price winter-summer spread
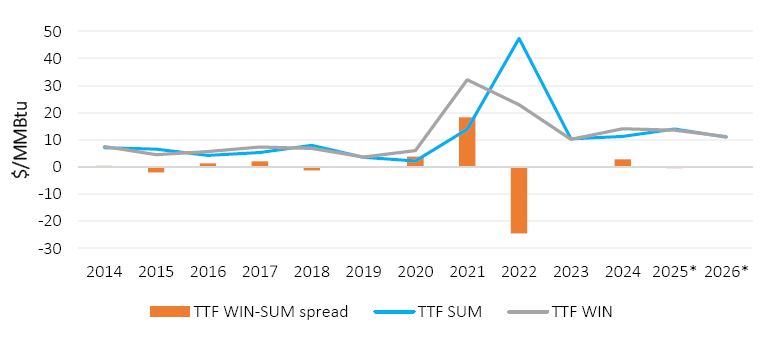
Source: GECF Secretariat based on data from LSEG
Note: TTF SUM is the average TTF summer price from May-September of the current year (Y). TTF WIN is the average TTF winter price from November (Y) – March (Y+1). For 2025-2026, TTF futures prices as of 14 March 2025 were used as a forecast.
The inter-regional price spread between Asia and Europe serves as a crucial indicator of spot LNG trade flows, reflecting changes in supply and demand dynamics across both regions. Historically, Asia has commanded a premium over Europe, with the latter acting as the market of last resort. However, the 2021-2022 energy crisis shifted this long-standing pattern. A surge in European LNG demand, driven by disruptions in traditional pipeline gas supplies, led to a sharp increase in TTF spot prices in 2022, with the NEA-TTF price spread turning negative the first time in history. In 2023-2024, the spread returned to historical patterns and became positive, with Asia regaining its premium over Europe (Figure iii).
Looking ahead, the NEA-TTF price spread is expected to turn negative again in 2025, marking only the second time in history. This shift will be driven by Europe’s increased LNG demand, necessary to replenish gas storage, which is expected to be at very low levels at the end of the 2024/2025 winter season, as well as to offset a projected decrease in pipeline gas imports. However, in 2026, the spread is anticipated to shift back to a slight positive, with Asia holding a modest premium over Europe. These evolving dynamics underscore a closer alignment between European and Asian spot prices, signalling a more integrated and adaptable global LNG market.
Figure iii: Trend in Asia-Europe spot gas price spread
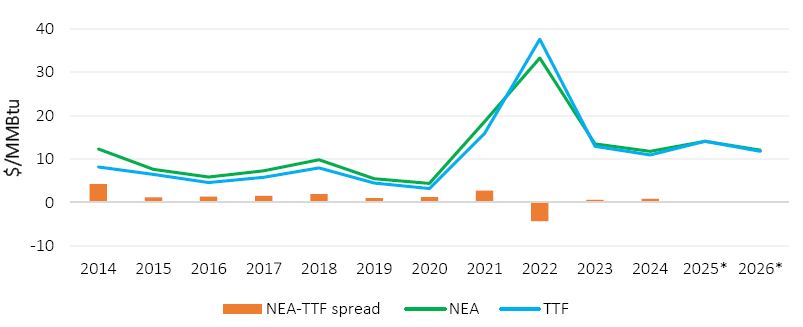
Source: GECF Secretariat based on data from Argus and LSEG
Note: For 2025-2026, TTF and JKM futures prices as of 14 March 2025 were used as a forecast.
The spread between spot prices and oil-indexed prices has long been a key indicator of the dynamics in the global gas trade. Historically, oil indexation in gas pricing has provided greater price stability and predictability, acting as a safeguard against market shocks and high volatility. In contrast, spot LNG prices are more closely tied to immediate market supply and demand conditions, reflecting shorter-term market fluctuations.
During the 2010s, spot prices tended to be lower than oil-indexed prices, prompting several regions — particularly the EU — to prioritize spot trading over long-term contracts. However, the market dynamics reversed dramatically during the 2021-2022 energy crisis. The EU, following its decisions to reduce pipeline gas imports, had to compete with Asia for available LNG cargoes. This competition drove spot prices to unprecedented levels, creating substantial price spikes and adversely impacting low-income gas importing countries, such as Bangladesh and Pakistan.
In the aftermath of this market shock, buyers began increasingly seeking oil-indexed contracts as a hedge against further price volatility. This shift was reflected in the pricing dynamics of the following years. In 2024, oil-indexed LNG prices averaged a substantial discount of $2/MMBtu compared to spot LNG prices in Asia. Looking ahead to 2025, this discount is expected to widen to $5/MMBtu, driven by rising spot gas prices and an anticipated decline in oil prices. However, by 2026, the discount is anticipated to narrow to $3/MMBtu, as spot prices soften and stabilize (Figure iv).
Figure iv: Spot and oil-indexed LNG price spreads
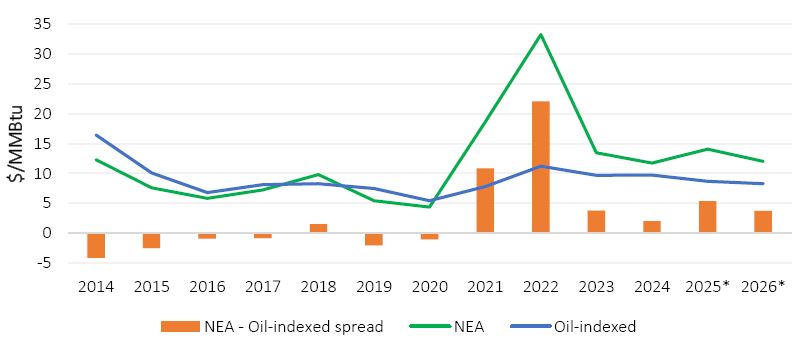
Source: GECF Secretariat based on data from Argus and LSEG
Note: Oil-indexed I LNG prices are used for 2014-2017 and Oil-indexed II LNG prices are used for 2018-2026. Oil-indexed I LNG prices are calculated using the traditional LTC slope (14.9%) and 6-month historical average of Brent. Oil-indexed II LNG prices are calculated using the 5-year historical average LTC slope and 3-month historical average of Brent. For 2025-2026, JKM futures prices as of 14 March 2025 were used as a forecast.